Google Data Studio is a free data visualization tool that makes it easy to create and customize dashboards by connecting to a variety of data sources. Google Analytics is one of the frequently used data sources for Google Data Studio.
If you are already using Google Analytics to track your community visitors, using Google Data Studio, you can create dashboards to visualize Google Analytics data for your community and share the same across teams.
Bettermode's Google Data Studio template is a ready-to-use dashboard with an overview of the most common metrics for a community performance report. It gives you a general outlook of month-over-month comparisons, what devices users are using, which countries they are coming from, top sources of traffic, key community landing pages, and popular web pages in the community.
Of course, you can customize the dashboard based on your needs and add additional data sources.
Here is how you can create a dashboard with Bettermode's Google Data Studio template:
1. Click here to access the sample.
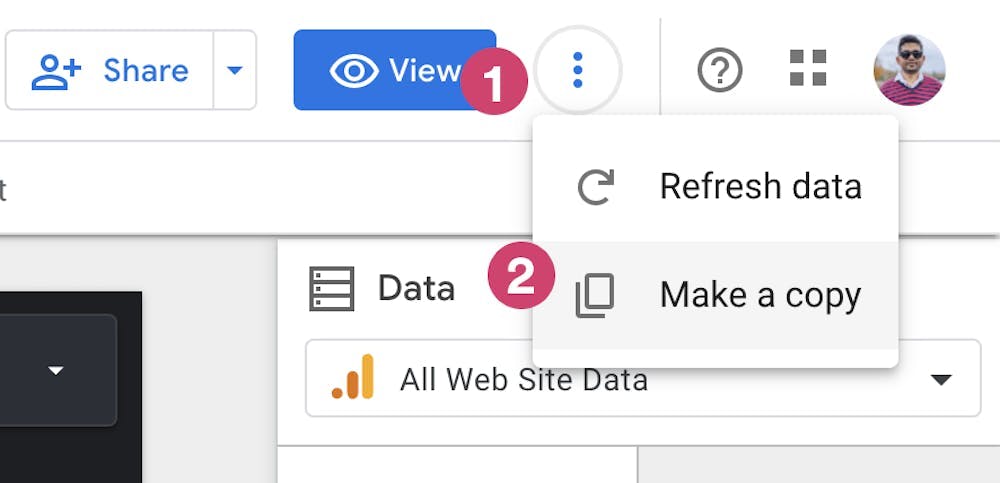
2. Click on [⋮] > Make a copy button on the top right.
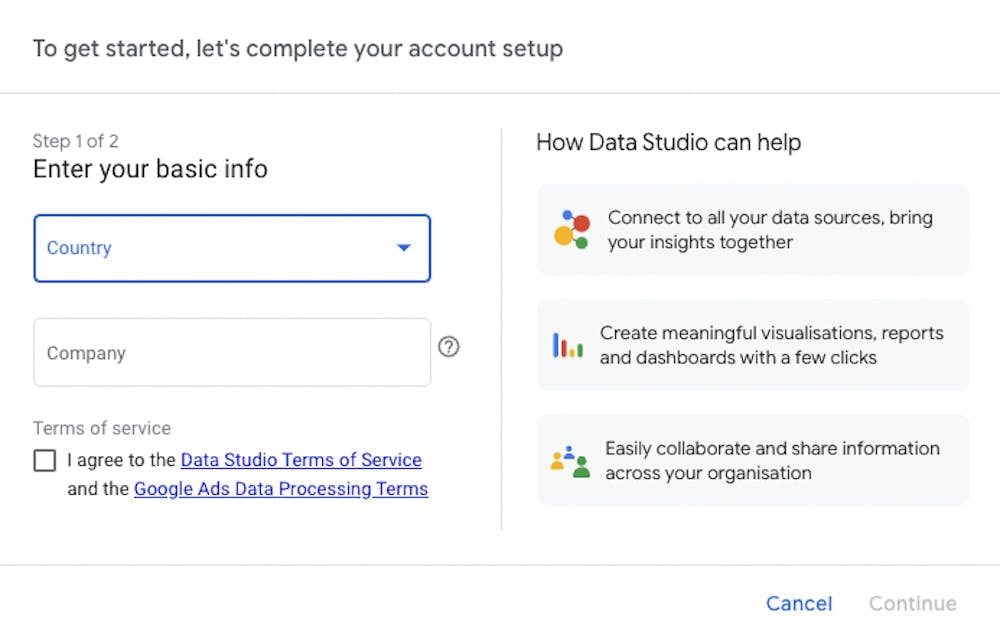
3. In case you don't have an account on Data Studio, you will be asked to create one. Select the info requested, click on Continue then Save.
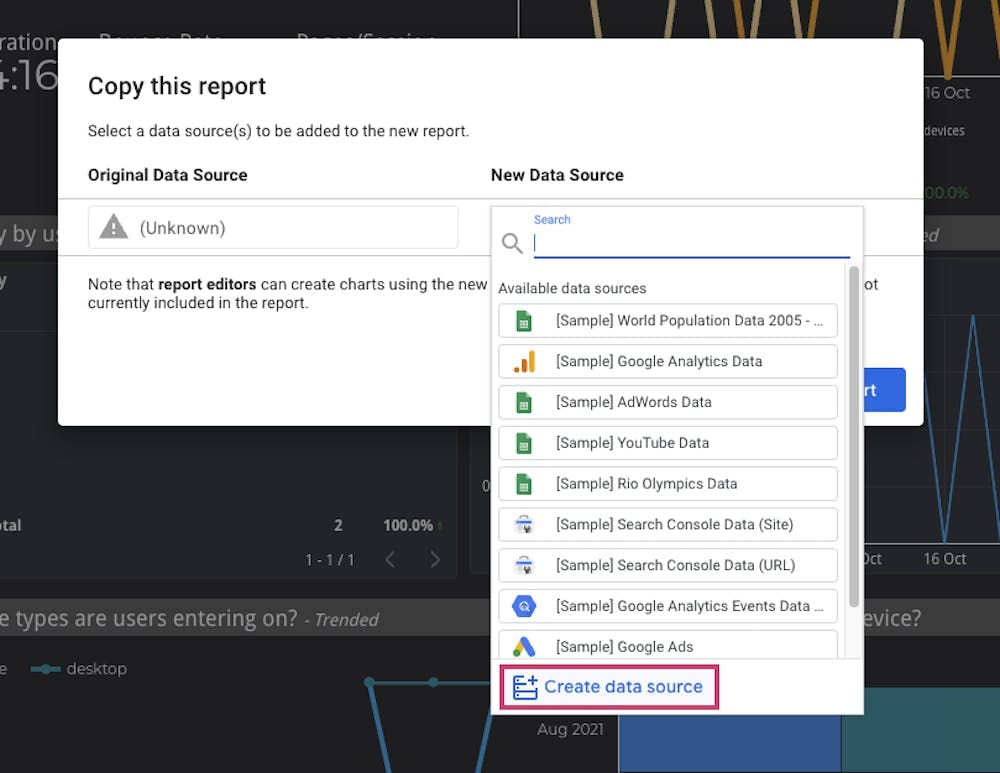
4. Once your account is created, you will have to click on [...] > Make a copy button on the top right once again.
5. Then, under the New Data Source menu, click on Create data source.
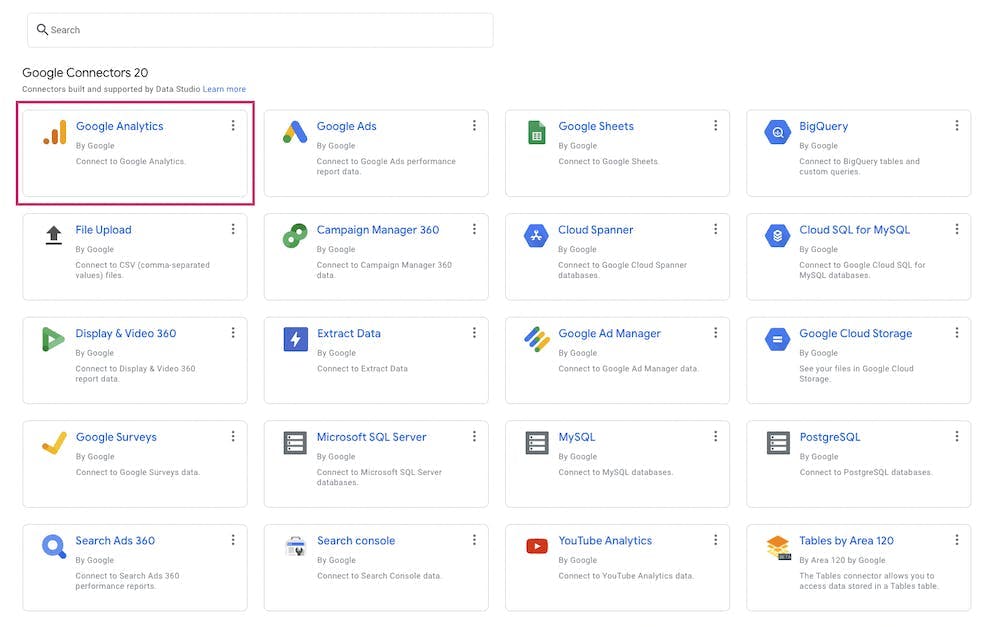
6. Now, select Google Analytics.
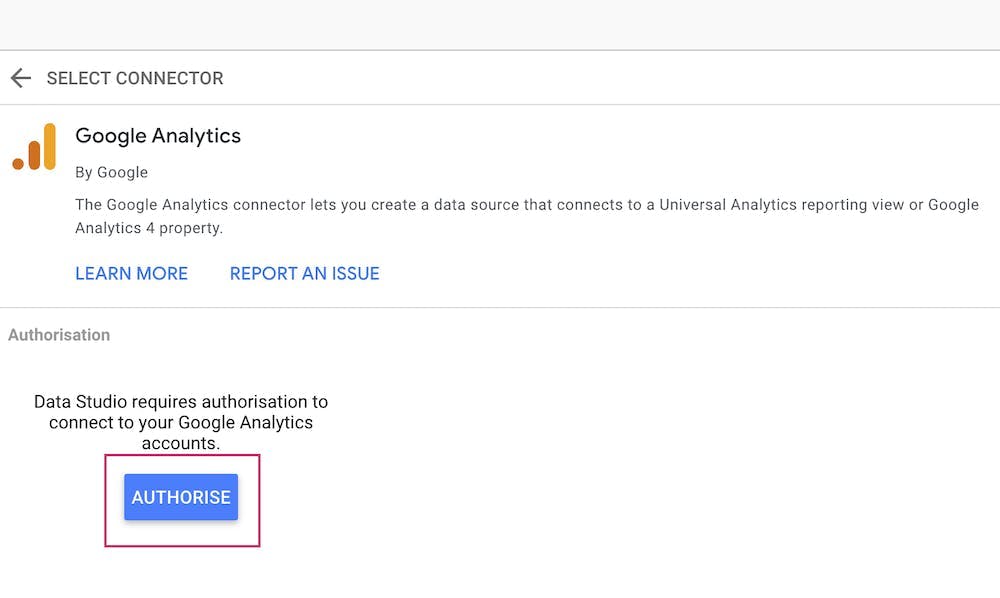
7. Authorize the connection between Data Studio and Google Analytics by clicking on Authorize.
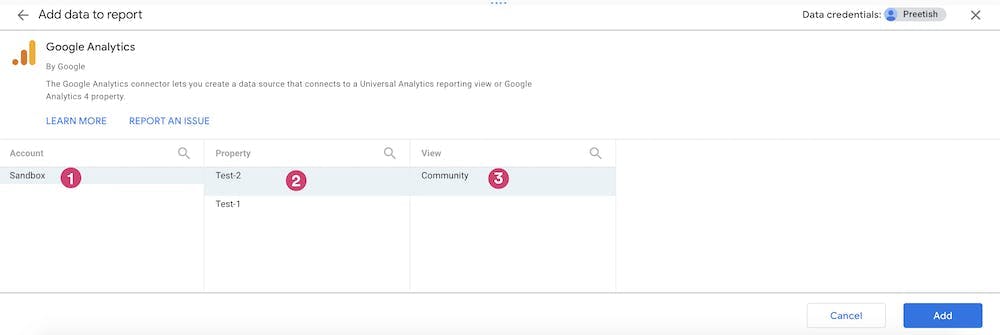
8. Select the connector by choosing the Account > Property > View you want to use from your Google Analytics, then click on Connect.
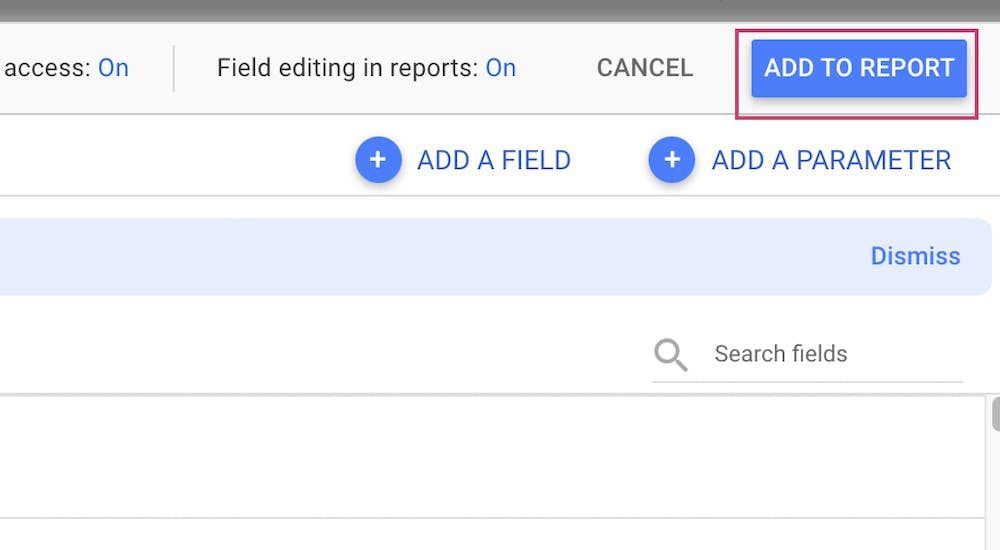
9. Click on Add To Report.
10. Finally select the Google Analytics view dedicated to your community and click on Copy Report.
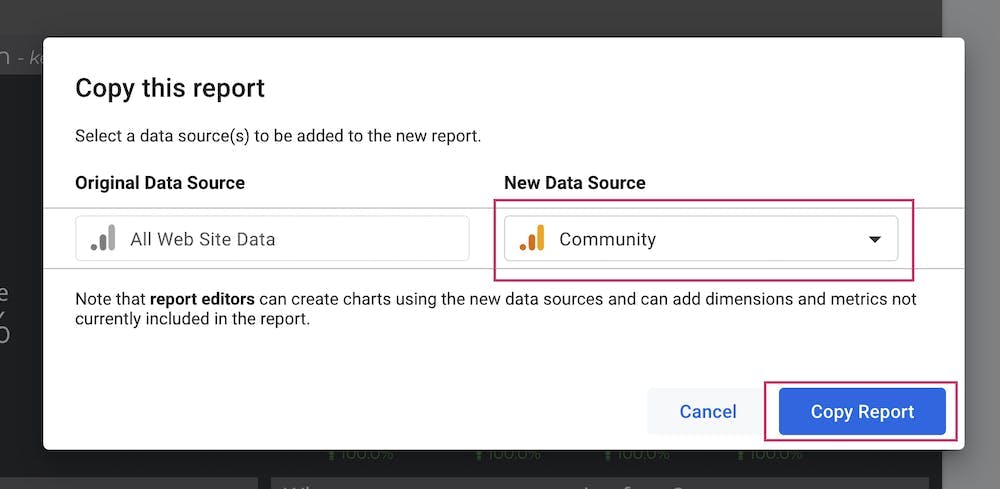
Now your report is ready with visualizations. You can completely customize the report by changing and adding new charts.
Related Topics:
Learn how to:
Learn more about:


