Data-Driven Support: Leveraging 14 Metrics for Team Success
-min.avif)
Can you estimate the percentage of customers who don’t do repeat business after one bad customer service experience?
The answer is 59%!
Quite evident that customer support is one of the most impactful business functions for customer experience and retention. In fact, the success of companies such as Zappos is largely attributed to customer service.
Customer support, as a discipline, prospers with empathetic and intimate human connections. As a brand, your ability to do so affects whether people buy your product and then continue to do so in the future.But how do you know when your team is delivering the type of support that satisfies customers?Customer support metrics can help.
Measuring the right ones shows the activities your support team excels at and those they need to improve.
Key customer support metrics
The most critical part of business management is knowing what to track. That’s why we’ve created this list of 14 metrics you can use to measure your team’s performance and identify areas for improvement in the customer support function.For each point, we’ve explained what the metric shows, how you can use it, and the steps you can take to improve performance.
Ticket volume
Ticket volume is the number of requests for help your support team receives in a given period. The higher the number, the more work your team has.On its own, this metric won’t tell you much about your team’s performance. A high volume isn’t always bad and it’s only natural that as your customer base grows, so will the number of tickets you receive.But by tracking ticket volume, you can make informed decisions about how to help your team deal with the extra work.
How to measure and reduce ticket volume
Calculate ticket volume by totaling the number of support requests your team receives in a period.If you notice ticket volume is increasing, you have two main options.The first is simply to hire more support agents. This will help team members deal with the increase in tickets.The second is to improve the self-service support tools available to customers.
This will reduce ticket volume by empowering customers to solve problems on their own.
At Bettermode, we use a knowledge base and a customer community to help our customers help themselves.Meanwhile, our customer community reduces volume by encouraging members to solve each other’s problems.
When people have an issue they post in the community and other customers or a member of our support team quickly help.Another benefit is that these conversations are searchable. Customers have access to an ever-increasing library of solutions to problems we might not have covered in our knowledge base.

You can take this self-service customer service approach powered by a customer community to the next level with powerful integration inside your app or product. For example, when your customers are searching for a solution right inside the product, discussions from the community can be returned.
One of Bettermode's customers, Octorate, a property management platform for tourism establishments, has integrated the search function inside the software using Bettermode API. You can see that whenever a search term is entered, it shows results from the community as well.

Finally, you can use a knowledge base to list solutions to common customer questions. Customers turn to this resource when they have a problem. They only contact our team when they can’t find an answer.

Ticket backlog
Having a high ticket volume isn’t a problem if your team can deal with all the issues. But it is a problem when these tickets overwhelm your team and lead to a backlog.A backlog of tickets means that you aren’t serving customers as quickly as you should. It’s defined as the number of unresolved support tickets in a particular time frame.This inevitably hurts the customer experience. Research by Zendesk shows that long wait times are the most frustrating part of a service experience.

How to measure and reduce the backlog
To calculate backlog, you first need to define what is an acceptable timeframe for customers to wait. Look at the average amount of time it takes to help a customer to get a general idea. Once you have a number, calculate how many tickets have been open longer than this.Reduce backlog by dealing with excessive ticket volume using the strategies mentioned above: hiring more reps or increasing self-service options.
Support teams will often have some level of unavoidable backlog. For example, when a customer is late to provide information reps need to solve an issue.But by tracking backlog over time, you’ll get a better idea of when it starts to creep up beyond an acceptable rate.
Community Resolution Rate
When customer community members solve each other’s problems, it reduces the number of issues your support team has to deal with.The percentage of total tickets solved by your community is known as your community resolution rate. Tracking this figure shows how effective your community members are at solving each other’s problems.
How to measure and improve Community Resolution Rate (CRR)
Measure CRR by dividing the number of tickets solved by your community by the total number of tickets submitted in the community. Multiply this by 100 to get the percentage.There are several steps you can take to improve your community resolution rate.These include:
- Community gamification features such as leaderboards and virtual currency that reward people for answering questions.
- Sending out notifications or emails to alert users to the latest posts.
- Requesting answer from people with the right expertise to solve an issue

Increasing overall community engagement can also help. We discuss ten tips you can use to drive community engagement in this article.
Self-service usage
Most businesses offer some form of self-service support, whether in the form of a knowledge base, a searchable customer community, or chatbots.It’s important to measure how customers use these self-service platforms, so you get an idea of their effect on your business. You can then use this insight to improve the self-service options you provide.How to measure and increase self-service usageWhat you measure will depend on the self-service tools your company uses.Here are some common types of self-service support and the metrics you can track:
- Customer community: Total users, number of active users, number of users that perform specific actions (e.g., posts per month). Here is the post with details of metrics that you should track for a customer community.
- Knowledge base: Pageviews, what people are searching for. Check out this post to learn more about key metrics for a knowledge base.
- Chatbots: The questions people ask, the percentage of people that go on to speak to customer support.
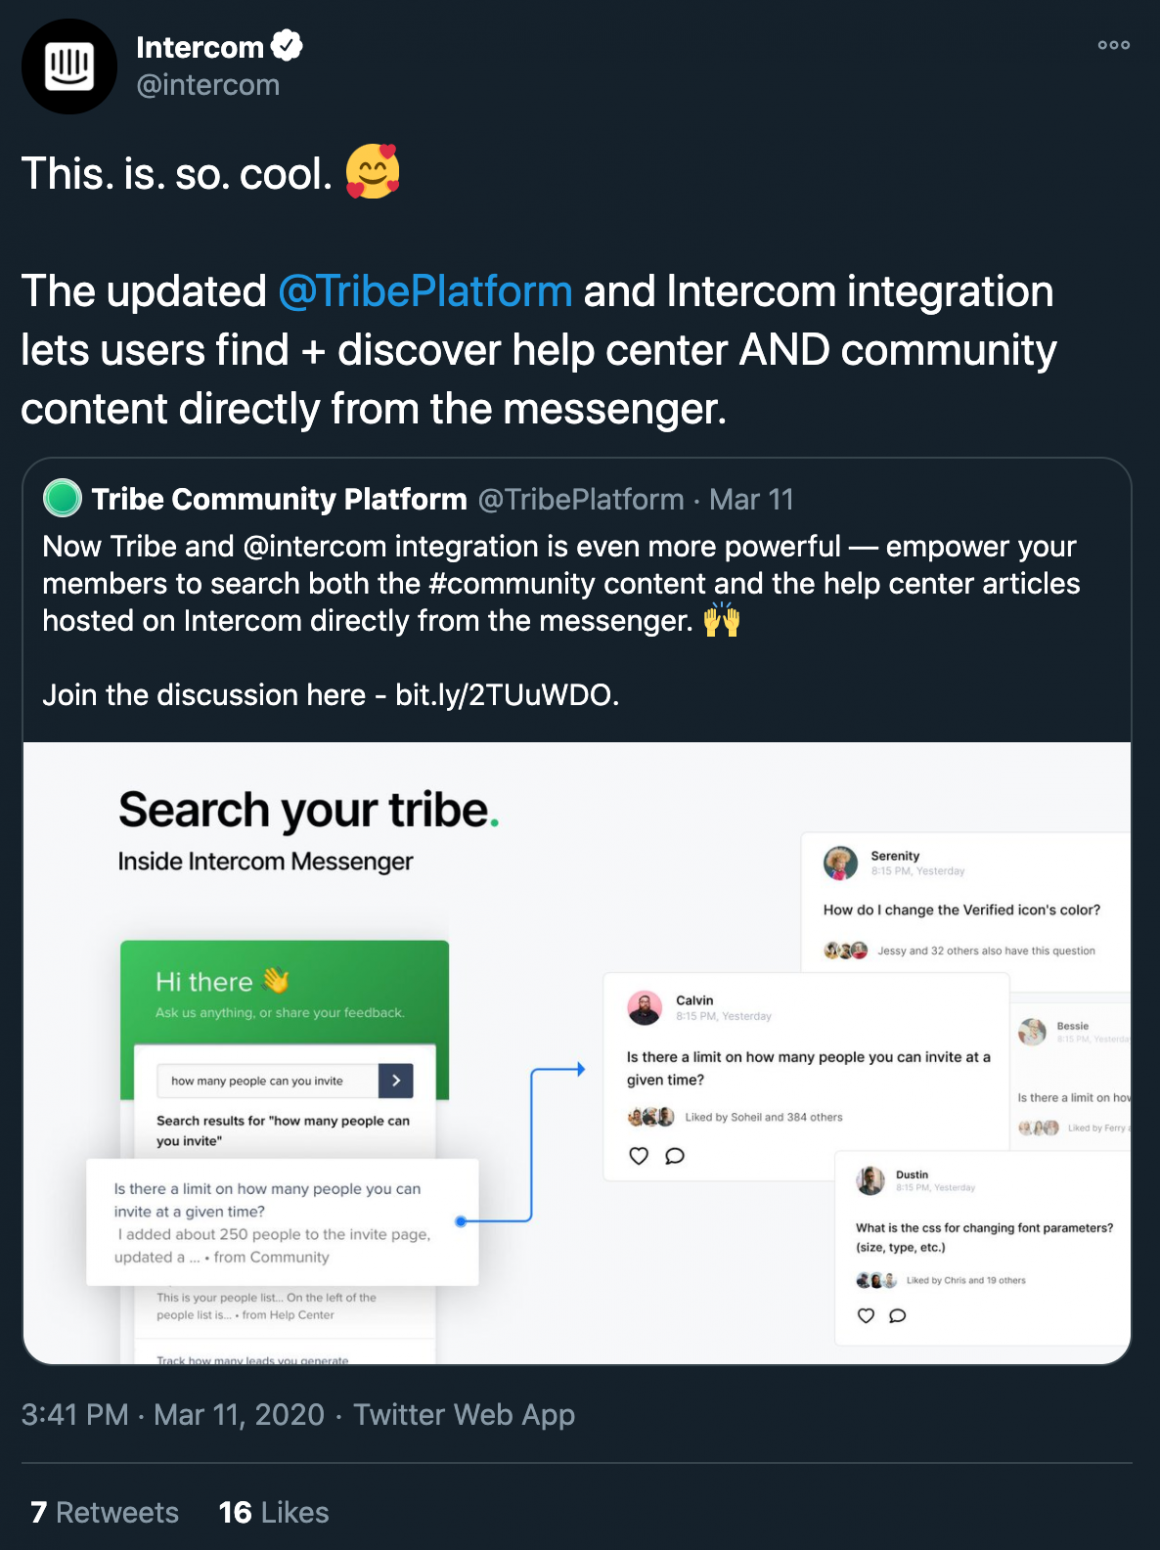
When analyzing self-service usage, always be on the lookout for ways to improve. For example, with Bettermode and Intercom integration, you can allow customers to search both the knowledge base and community content directly from the Intercom Messenger search function.
If people are using your knowledge base to search for a particular problem, consider building more support resources on this topic. Or, if you notice your customer community has a low active user rate, take steps to increase engagement.
First Response Time
First Response Time is how long it takes for your support team to reply to a customer request.A good first response time gets the customer support experience off to a positive start and can significantly affect satisfaction.Note that this metric doesn’t measure whether the response solves the problem. The first reply may simply acknowledge that you have seen the customer’s issue and are working on it.Of course, it’s better if your response is helpful and provides relevant information.
How to measure and reduce First Response Time
To measure First Response Time, you first need to choose a channel to track. Then, add up the total time it took to respond to the requests on the channel and divide this number by the total number of requests.
For this metric to be helpful, you need to know how quickly customers expect a response on various channels.For example, a recent report by SuperOffice found that 88% of customers expect an email response in under 60 minutes. But this would be an incredibly long wait for people who call or use an instant messaging service.
The key is to create benchmarks that match the type of support you offer and your customer expectations.Improve first response time by tracking when you receive the most requests and ensuring you have sufficient cover at these times.Providing customers with an estimate of the time it will take for a rep from the customer support team to follow up will set expectations and reduce frustration (even if it doesn’t directly affect your response time).
Average Resolution Time
While it’s great to respond quickly, what really counts is how fast you solve an issue. Average resolution time measures the time it typically takes your team to do so.The faster your team is, the lower this metric will be, and the fewer times customers will have to wait.
How to measure and improve Average Resolution Time
To measure your Average Resolution Time, calculate the total time it took your team to answer all requests, and then divide this by the total number of requests.Track this metric to check for changes over time. If you find your average resolution time is increasing, it could suggest that your support team is struggling to deal with ticket volume.Use it to track the times or days when your team is overworked and add further cover during these times.
First Contact Resolution Rate (FCR)
This measures the resolution rate of the customer support team in a single response. This will lower your average resolution time and provide a better overall customer experience.
How to measure and reduce FCR
Track FCR by calculating the percentage of tickets your team solved on the first contact.Divide the number of tickets solved on the first resolution by the total number of tickets, then multiply this by 100.Improve this number by ensuring your customers know where to ask about specific problems. This ensures the correct person can respond.
You can also create forms that encourage customers to provide as much relevant detail as possible about their issue. This increases the likeliness that your team will be able to solve problems in a single contact.Be aware that a low first contact rate doesn’t always suggest poor service.If you have a policy that sees support staff reach out as soon as someone opens a ticket to tell them they are working on the issue, your first contact resolution rate will be low, but your first response time will be high.
Interactions Per Case
Interactions per case simply refer to the number of times your team contacts a customer before the issue is marked as solved.A lower number typically suggests that your team works effectively and solves problems quickly.
How to measure and reduce interactions per case
Calculate interactions per case by totaling the number of interactions and then dividing this by the number of support tickets you have.If your number is too high, you have several options:
- Train your team to ask better questions to build a complete picture of a customer’s problem.
- Use existing customer data to get background information on problems without asking customers. Properly tag the conversions for further analysis on recurring problem areas.
- Offer self-service support so customers can build an understanding of their problems before contacting your team.
- Ensure customers know where to ask different types of questions. For example, if you are empowering customers to ask for help in a customer community, create a dedicated space. Given below is an example, of how ConvertKit leverages help forum inside the community:

It’s not always necessary to make this number as low as possible.Interactions between customers and your support team—for example, anticipating potential future issues and making the customer aware of them—can positively impact the customer experience.
Resolution Rate
Your resolution rate is the percentage of customer support tickets that get solved, regardless of the time, it takes to solve them.Factors like dropped calls or impossible requests mean that resolving every issue is difficult. But the number should be as close to 100% as possible.
How to measure and increase Resolution Rate
Measure your Resolution Rate by dividing the number of resolved tickets by the total number of tickets in a period of time and then multiplying this by 100.Be sure to analyze unresolved tickets to see why your team wasn’t able to solve the problem adequately. You can then take steps to ensure they are better prepared in the future.
Average Handle Time
If you offer phone or real-time message-based support, consider measuring the number of times customers spend talking to support agents.This is called the Average Handle Time. As customers tend to want fast answers to their problems, a low average handle time is considered a good thing.
How to measure and improve Average Handle Time
Calculate average handle time by totaling the number of time reps spend helping customers and divide this by the number of conversations.Set the timer from the moment the support rep answers the call to the moment the conversation ends. Don’t include time spent on hold or interacting with an IVR system.Be aware that problems can arise if you focus more on the time it takes to solve issues than your service quality. Measuring customer experience and satisfaction will show you if you are getting the right balance.
Customer Satisfaction (CSAT)
Tracking customer satisfaction will show you how happy customers are with the service they receive from your team. This is one of the most important customer support metrics.It will highlight when your team is doing things right and when they need to improve. Satisfied customers are more likely to become repeat buyers and recommend your company to others.
How to Measure and Improve Your Customer Satisfaction Score
Unfortunately, satisfaction is subjective and hard to track. The best option is to provide short customer satisfaction surveys after a ticket closes.A common way to do this is to ask a simple question like “How satisfied were you with the support you received today” and then providing multiple choice answers.Ask this question as soon as the customer finishes talking to your team. Here is an example question based on a Likert scale:

How you improve customer satisfaction will depend on why customers aren’t satisfied with your support in the first place. A low CSAT due to slow service requires a different fix to a low rating because the team was unable to solve the problem.Consider including a comment box for customers to provide extra information about why they gave their answers. This qualitative answer will point you in the right direction for fixing poor scores.
Net Promoter Score
Net Promoter Score (NPS) measures how likely a customer is to recommend your product or service to people they know. It’s an important metric to track as it can directly impact revenue and sales.Note that customer support isn’t the only factor that will influence NPS. The quality of your product, its price, usability, and brand power will all affect whether people are willing to recommend your product.
How to measure and improve NPS
To measure NPS, you simply ask customers:On a scale of 0 to 10, how likely is it that you would recommend [your company] to people you know?Customers who answer from 0 to 6 are detractors, 7 or 8 are passive, and 9 or 10 are promoters.To calculate the net score, calculate the percentage of responses in each group and then subtract the percentage of detractors from the percentage of promoters. The number you’re left with is your NPS score.

Customer Effort Score
Your Customer Effort Score (CES) is a metric designed to measure the effort customers put in when dealing with your organization.A low effort score suggests you are exceeding customer expectations and delivering positive outcomes. A high effort score indicates that customers find dealing with your brand difficult. It hints at a poor customer experience.
How to Measure and Improve CES
You measure CES by asking a single question:To what extent do you agree or disagree with the following statement: The company made it easy for me to handle my issues.
- Strongly disagree
- Disagree
- Somewhat disagree
- Neither agree nor disagree
- Somewhat agree
- Agree
- Strongly agree
Calculate the percentage of customers that answer “Somewhat agree”, “Agree”, “Strongly agree” from the percentage of customers that reply with “Somewhat disagree” and lower.If you have a high CES, try to find ways to make the customer experience more manageable. Look for pain points like customers having to repeatedly contact your team to find an answer or insufficient replies from your customer service team.Improving self-service support can improve CES by making it easy for customers to access the information they need when they need it.
Another option is to train employees to anticipate future issues and proactively provide information about these problems.
Customer Churn Rate
Customer Churn Rate refers to the percentage of customers that stop using your product or service in a period.The lower your churn rate, the more you’ll earn per customer, and the less you’ll have to rely on new customers for growth.
How to measure and lower Churn Rate
To measure churn, you just need to calculate the percentage of customers that cancel their subscriptions in a given time frame.Whether a customer churns isn’t entirely down to customer support. But great support improves the customer experience, which can have a material impact on whether customers stick with you in the long run.
Choose the most important customer support metrics
Remember that no single metric will tell you if you are delivering an excellent support experience.You may be quick to respond but if your information isn’t good you won’t solve problems. Because of this, you should be sure to track several customer support metrics.Choose the ones that you think are important and then track them over time. This will provide insight into how your team is performing and where you need to make improvements.